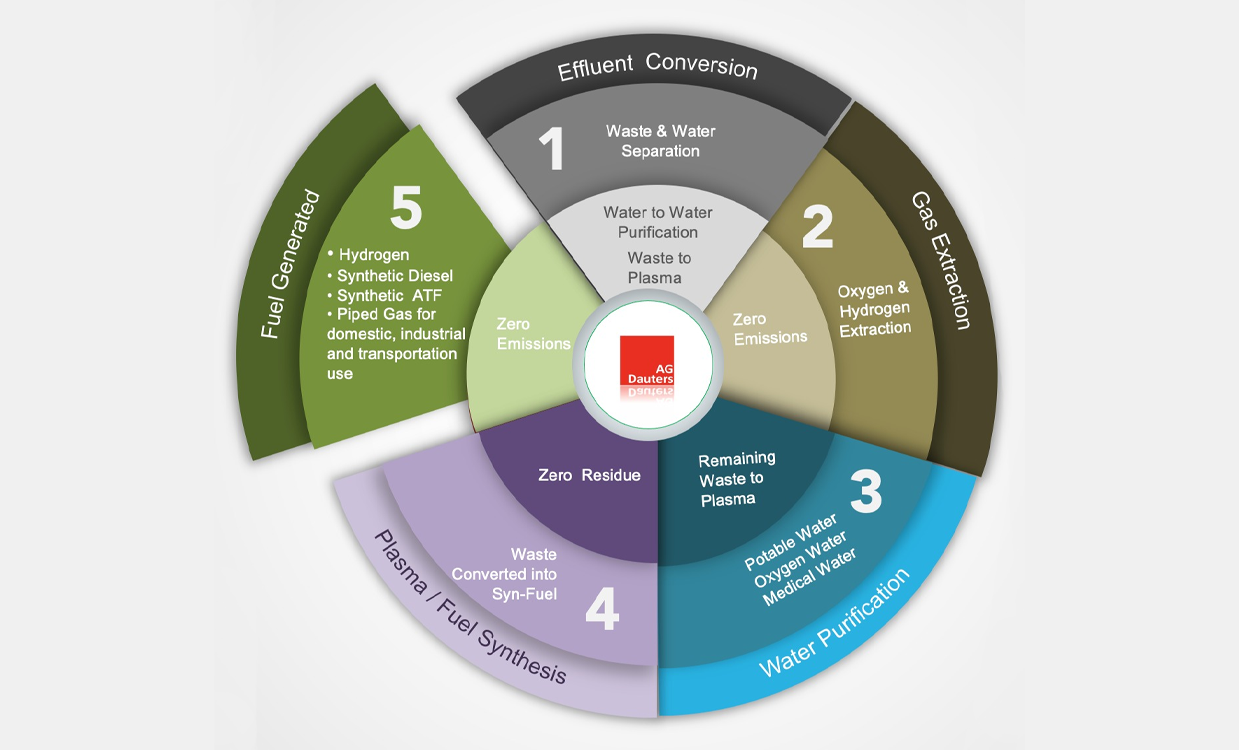
LT Waste Power Water Schematic

LT Process flow

The feedstock into the plant can be any of these waste

  • MSW (Municipal Solid Waste)
  • Sewage
  • Industrial / mining waste
  • River / pond / lake water
  • Ocean / seawater
  • Industrial brine
  • Sludges / slurries
  • Pharma / bio / medical
  • Toxic / hazmat / heavy metal
  • Oil frack
  • Hydroponics water
  • Fly ash
  • Steel mill slag
  • Tar / chemicals

offerings

  • The Capital or Operational Expenditure i.e. Capex or Opex is zero.
  • Small Parcel of Land on Lease
  • The Carbon Credits are shared with the State
  • The Fuel is offered on Discounted price
  • Watersupply as per govt. procurement policy
  • Power sold at CERC WTE rates
  • Our Commitment

    If we do not deliver what we promise, will dismantle plant and handover vacant land!

How we are different from other energy sources

Comparison between Non Conventional
Projects : 50 MW
Solar Wind Inciner
ation
Hydro LT
Plasma
PLF 19% 27% 75% 50% 95%
Land in
acres
250 125 20 Extremely
high
02
Grid
Utilisation
20% 27% 75% 50% 95%
Input
Feedback
X X 5000
mtpd
X 150
mtpd
Segregation X X Yes X No
Drying X X Yes X No
Comparison between Conventional Projects
with LT Plant : 500 MW
Thermal Gas Nuclear LT
Plasma
PLF 75% 90% 95% 95%
Land in
acres
1000 250 250 03
Residue Ash X N Waste X
O & M High High Very high Nil
Environmental
Issues
High Moderate High Nil
Manpower High Moderate Moderate Low
Emissions Very high High Moderate Nil

Our Safeguards

Toxic
Nothing released
in air or ground

Residue
If anything, is ionized

Redundancy
100%

Combustible
Nothing stored or
used

Explosive
No processes or
materials usedused

Monitoring
24 x 7 through LT
Satellite